
The financial report answers the question most record-keeping never gets to: is any of this making money?
Getting there
Reports in the sidebar, then the Financial Report card.
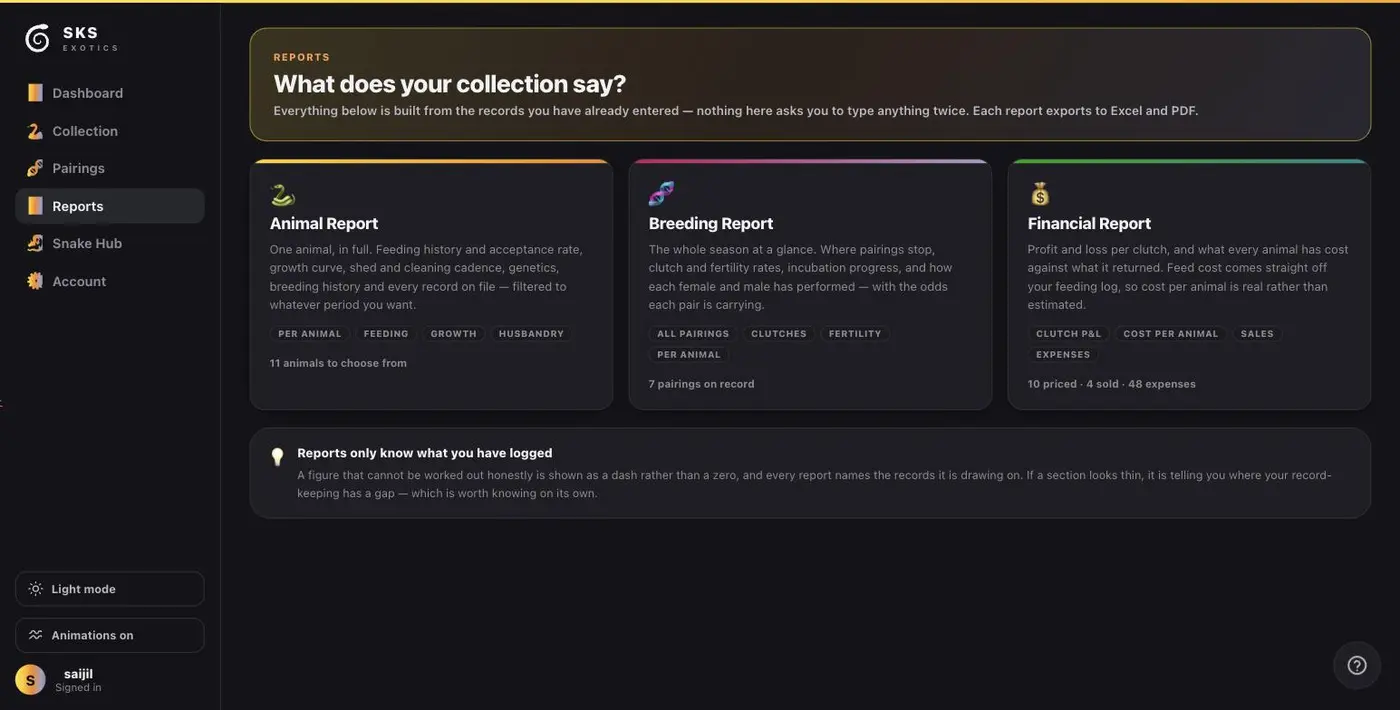
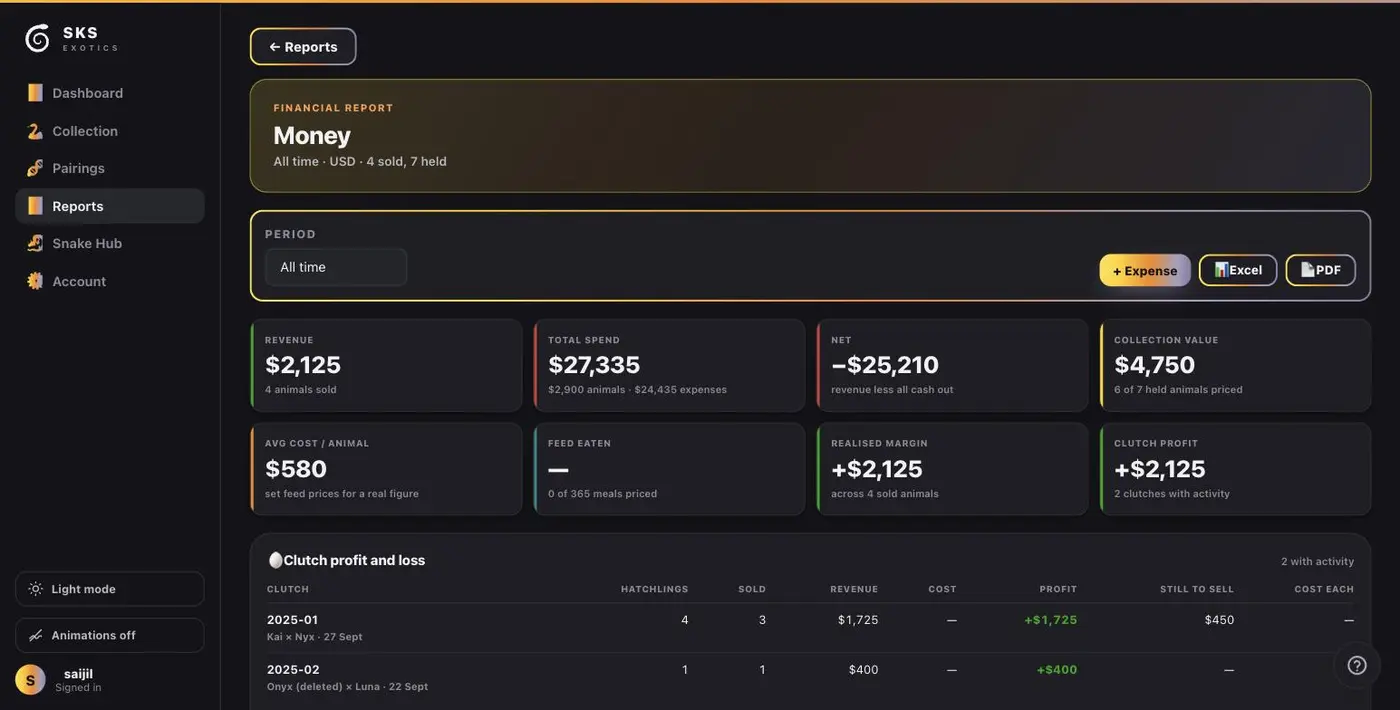
The Period selector at the top works the same as the animal report, and Excel and PDF export what is on screen. + Expense adds a cost without leaving the page.
The eight figures
- Revenue — what sold animals actually brought in.
- Total spend — split between what you paid for animals and everything else.
- Net — revenue less all cash out. A negative number early on is normal; a collection is a capital purchase before it is a business.
- Collection value — what you are holding, at your own asking prices. It also tells you how many of your held animals are priced, which is the honesty check on that number.
- Avg cost / animal.
- Feed eaten — feed cost taken from your feeding log, not estimated. It shows how many meals are priced out of the total, so you can see how complete it is.
- Realised margin — across animals that have actually sold.
- Clutch profit — across clutches with activity.
Clutch profit and loss
Below the figures, one row per clutch: hatchlings, how many sold, revenue, cost, profit, what is still to sell and the cost each. This is where a season stops being a feeling and becomes a number.
Getting real numbers out of it
Three things drive everything above, and all three are things you enter elsewhere:
- Price paid on each animal, so cost is not zero.
- Asking price on held animals, so collection value means something.
- Feed prices, so "Feed eaten" is real rather than a dash. Until they are set the report says so, in the tile itself.
Every figure here is built from records you entered for other reasons. Nothing asks you to keep a second set of books.